SERS Diagnostic Biosensor
Raman Spectroscopy - Optical Fingerprint
Whereas fluorescence spectroscopy probes the
electronic states of a molecule, Raman spectroscopy provides
information by probing the vibrational and rotational states of the
molecule. Further, the energy of a vibrational mode depends on
the molecular structure, environment, bond order, molecular
substituents, molecular geometry, and hydrogen bonding, and
therefore can provide a molecular optical fingerprint
 |
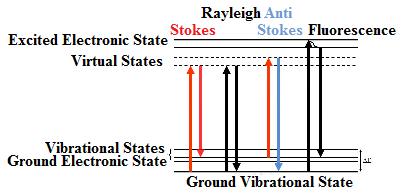 |
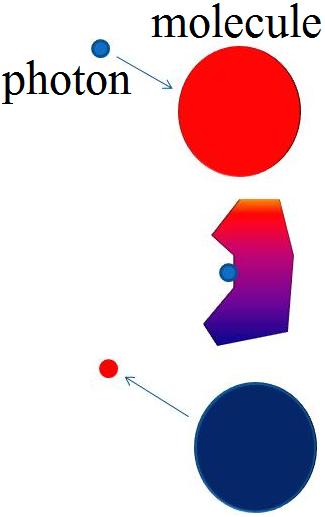
| The Raman process occurs when a photon collides with the electron cloud of the molecules and perturbs the electric cloud resulting in an energy loss. The change in color represents a change in energy of the molecule and photon | The Jablonski diagram compares Raman and Rayleigh scattering. The molecule is excited to a virtual state lower in energy than a real electronic transition. A Stokes Raman shift occurs when a photon loses energy, whereas an Anti-Stokes Raman shift occurs when the photon gains energy. Rayleigh scattering occurs when no energy is lost. Fluorescence occurs when the photon is actually excited to another electronic state. |
The advantages of Raman spectroscopy include lack of photobleaching (as seen with fluorescencent organic dyes), the excitation wavelength does not have to be in resonance an electronic state, narrow spectral bands that increase the potential for multiplexing, and signal processing and multivariate techniques can extend the capabilities. On the other hand, since the Raman scattering effect occurs in 1 in 106 scattering events, the resulting signal can be very weak. Plus, broad fluorescence and absorption bands of the target molecule can drown out the Raman signal.
Surface Enhanced Raman Spectroscopy (SERS)
SERS provides a means of amplifying the signal, through electromagnetic and chemical enhancements, on the order of 106 - 1012 times. The SERS process relies on three mechanisms: (1) wavelength of incident light, (2) excitation of surface plasmons, and (3) the near field of the target molecule. When the wavelength of incident light matches the the plasmon resonance band of the substrate and the molecule is sufficiently close, the effective optical cross-section of the molecule increases, leading to a enhanced field. However, the issues that occur with SERS arise due to non-reproducible Raman spectra because of random "hot spots" of the substrate.
There are three components to a SERS biosensor:
(1) Substrate that can support surface plasmons: noble metal (e.g., silver and gold) nanostructured elements.
(2) Mechanism to allow target molecule to become sufficiently close to substrate: microfluidics or direct adsorption
(3) Provide qualitative or quantitative information of the target molecules.
Nanofluidic Biosensor
We have developed a nanofluidic biosensor with the following features: size dependent trapping of 60 nm gold colloid at the entrance to a 40 nm nanofluidic channel, capillary force allows the target molecule to be trapped in the interstices of the mechanically aggregated gold particles, principle sites where enhancement occurs, further, which concentrates the sample over time, and there is a high density of aggregated nanoparticles at a precise region.
 |
| The nanofluidic biosensor mechanically aggregates the gold colloid to create reproducible SERS active sites within the interstices of the aggregated gold colloid at a precise location that can easily be interrogated with an objective lens. (A) is the side view, (B) is the top view. The solution of gold colloid plus the target molecule are introduced at the reservoirs. |
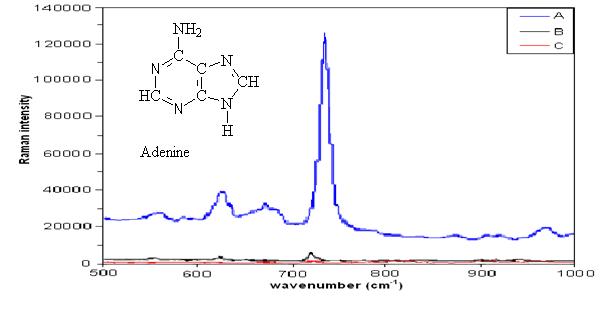 |
| This figures shows a 1014 enhancement of 740 μM adenine (blue) in the nanofluidic biosensor over 1 mM (red) and 1 M (black) adenine without the use of the device. The enhanced spectra was taken at the entrance to the nanochannel. |
Diagnostic Sensor for Alzheimer's Disease
We are developing a diagnostic sensor for β-amyloid (Aβ), implicated in the neurotoxicity of Alzheimer's disease (AD). Currently, there are no pre-mortem tests to definitively distinguish AD from mild cognitive impairment due to old age. Plus, due to the aging of the baby boomer generation, the incidence of AD is expected to continue to rise. With the use of the nanofluidic biosensor, we were able to distinguish spectral changes due to secondary structures (Amide III region, 1200 – 1300 cm-1) that correlate with concentration.
 |
|
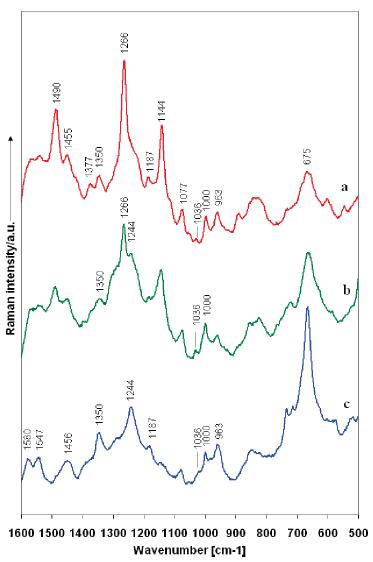
SERS spectra of
Aβ
at trace concentrations: (a) 11.5 pM
(b) 1.15 nM (c) 11.5 nM after 24 h in the nanofluidic device. At
higher concentration over time the sample conforms to a more
toxic, β-sheet rich structure, which is reflected by shifts in
the Amide II I region. Scans were taken from the nanoparticle
clusters at the entrance to the nanochannel using 50× (NA )
0.75) air objective with a 785 nm excitation laser. |
This nanofluidic biosensor offers the following
advantages for detecting Aβ
(1) The SERS active environment is highly
reproducible since the nanoparticle-molecule
(2) The target molecules are concentrated over
time at the entrance to the nanochannel
(3) Since the bioactivity of the protein was
preserved, which allows the protein to undergo conformational changes,
this implies that we can probe proteins in solution without modifying
the protein and directly detect Aβ in cerebrospinal fluid.
Collaborators:
Dr. Jun Kameoka, Department of Electrical and Computer Engineering, Texas A&M University
Dr. Theresa Good, Department of Chemical Engineering, University of Maryland, Baltimore County
For more information, contact Melodie Benford.
Department of Biomedical Engineering | Dwight Look College of Engineering | Texas A&M University